

Add the Two Indicators the Method Uses
Where does the number actually go? The printed steps ask for an average at fifty and an index at fourteen, and only one of those is what the platform ships with.
So this lesson is four things. Finding an instrument, adding it, typing its number, and taking it off again.
Every indicator on this platform has the same two settings, and the second of them is almost never worth touching.
Where the instruments live
One button on that top strip opens a dialogue whose full name is Indicators, metrics, and strategies, which is longer than anything you will call it.
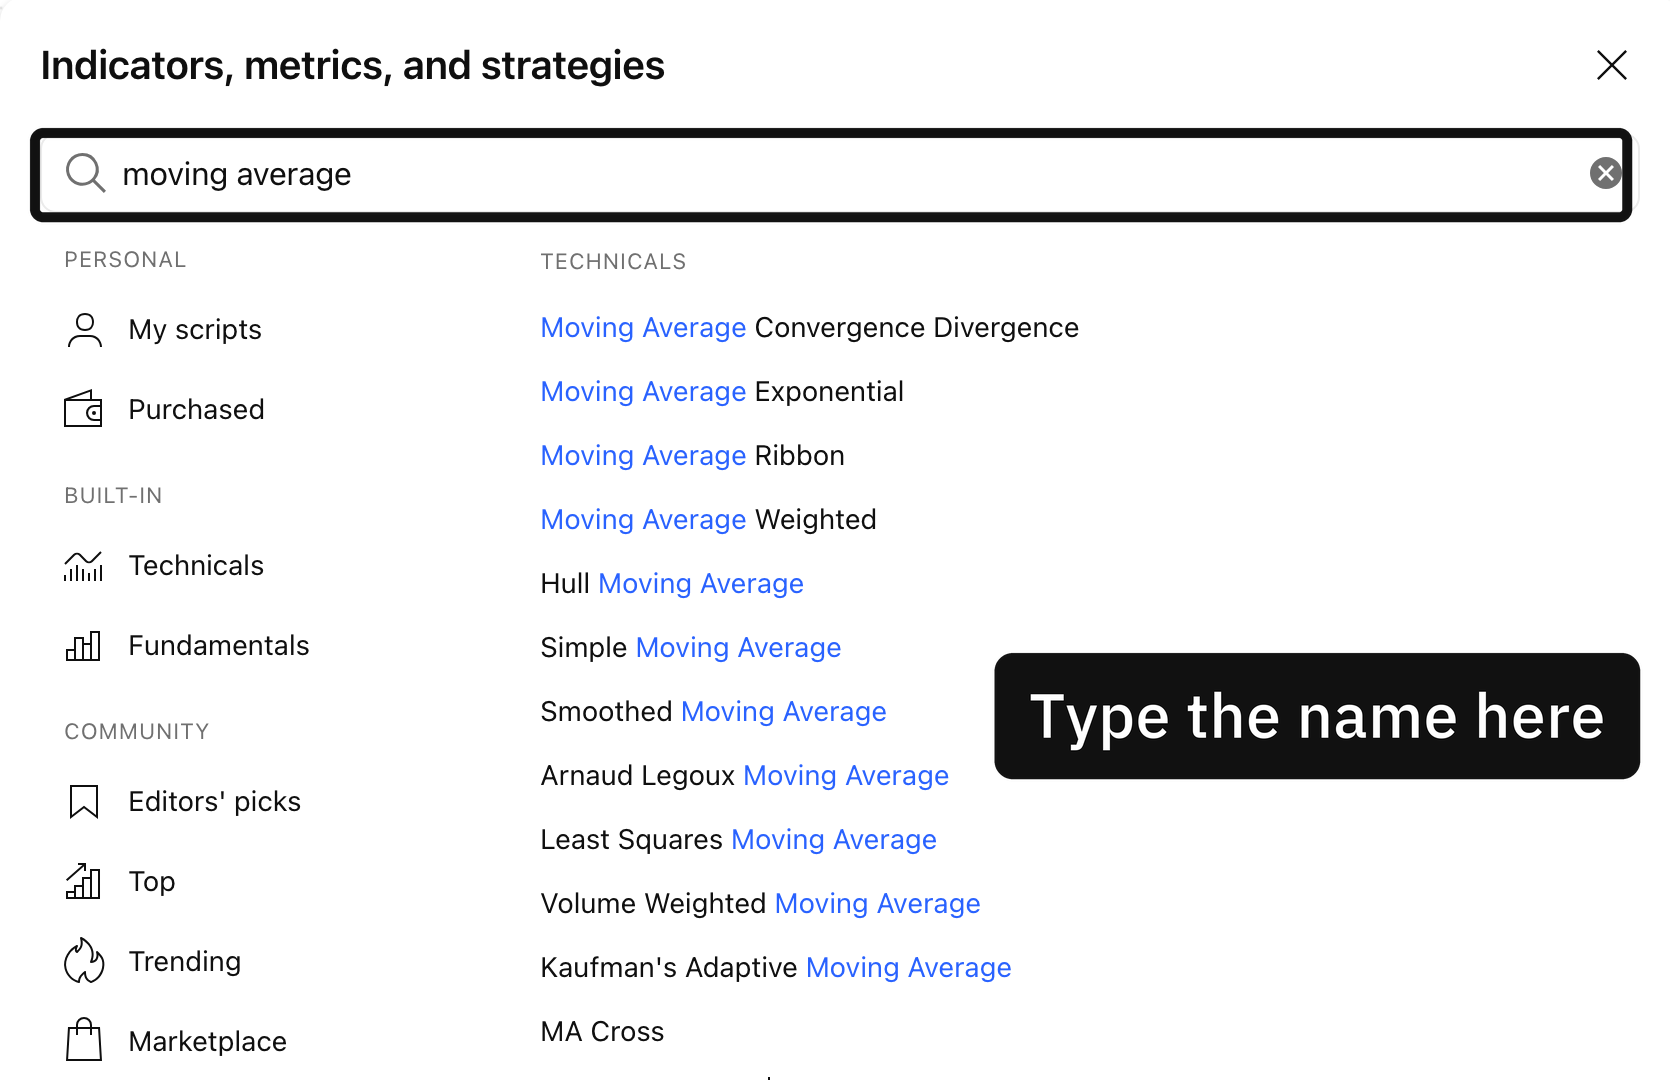
One dialogue holds every indicator on the platform, and the ringed box across the top is where you type the name rather than scrolling the list under it. Charts by TradingView.
Down its left side are the built-in instruments under Technicals, the company data under Fundamentals, and the scripts other people have written. Ignore all of it and use the search box.
Two of them land in two places
Type Simple Moving Average, click the result once, and a line appears drawn straight over the candles in the same pane, because it is measured in price and belongs on the same scale.
Now type Relative Strength Index and it opens a second pane underneath the first. It travels between zero and a hundred, so it has nothing to do with the price scale and cannot share it.
Both write their own name into the legend above the candles. Hover that name and its own small controls appear beside it.
The gear on that row opens the settings, and the settings open on their inputs. Length is how many candles it looks back over. Source is which of each candle's four numbers it reads, and it arrives on the close, which is the setting to leave alone.
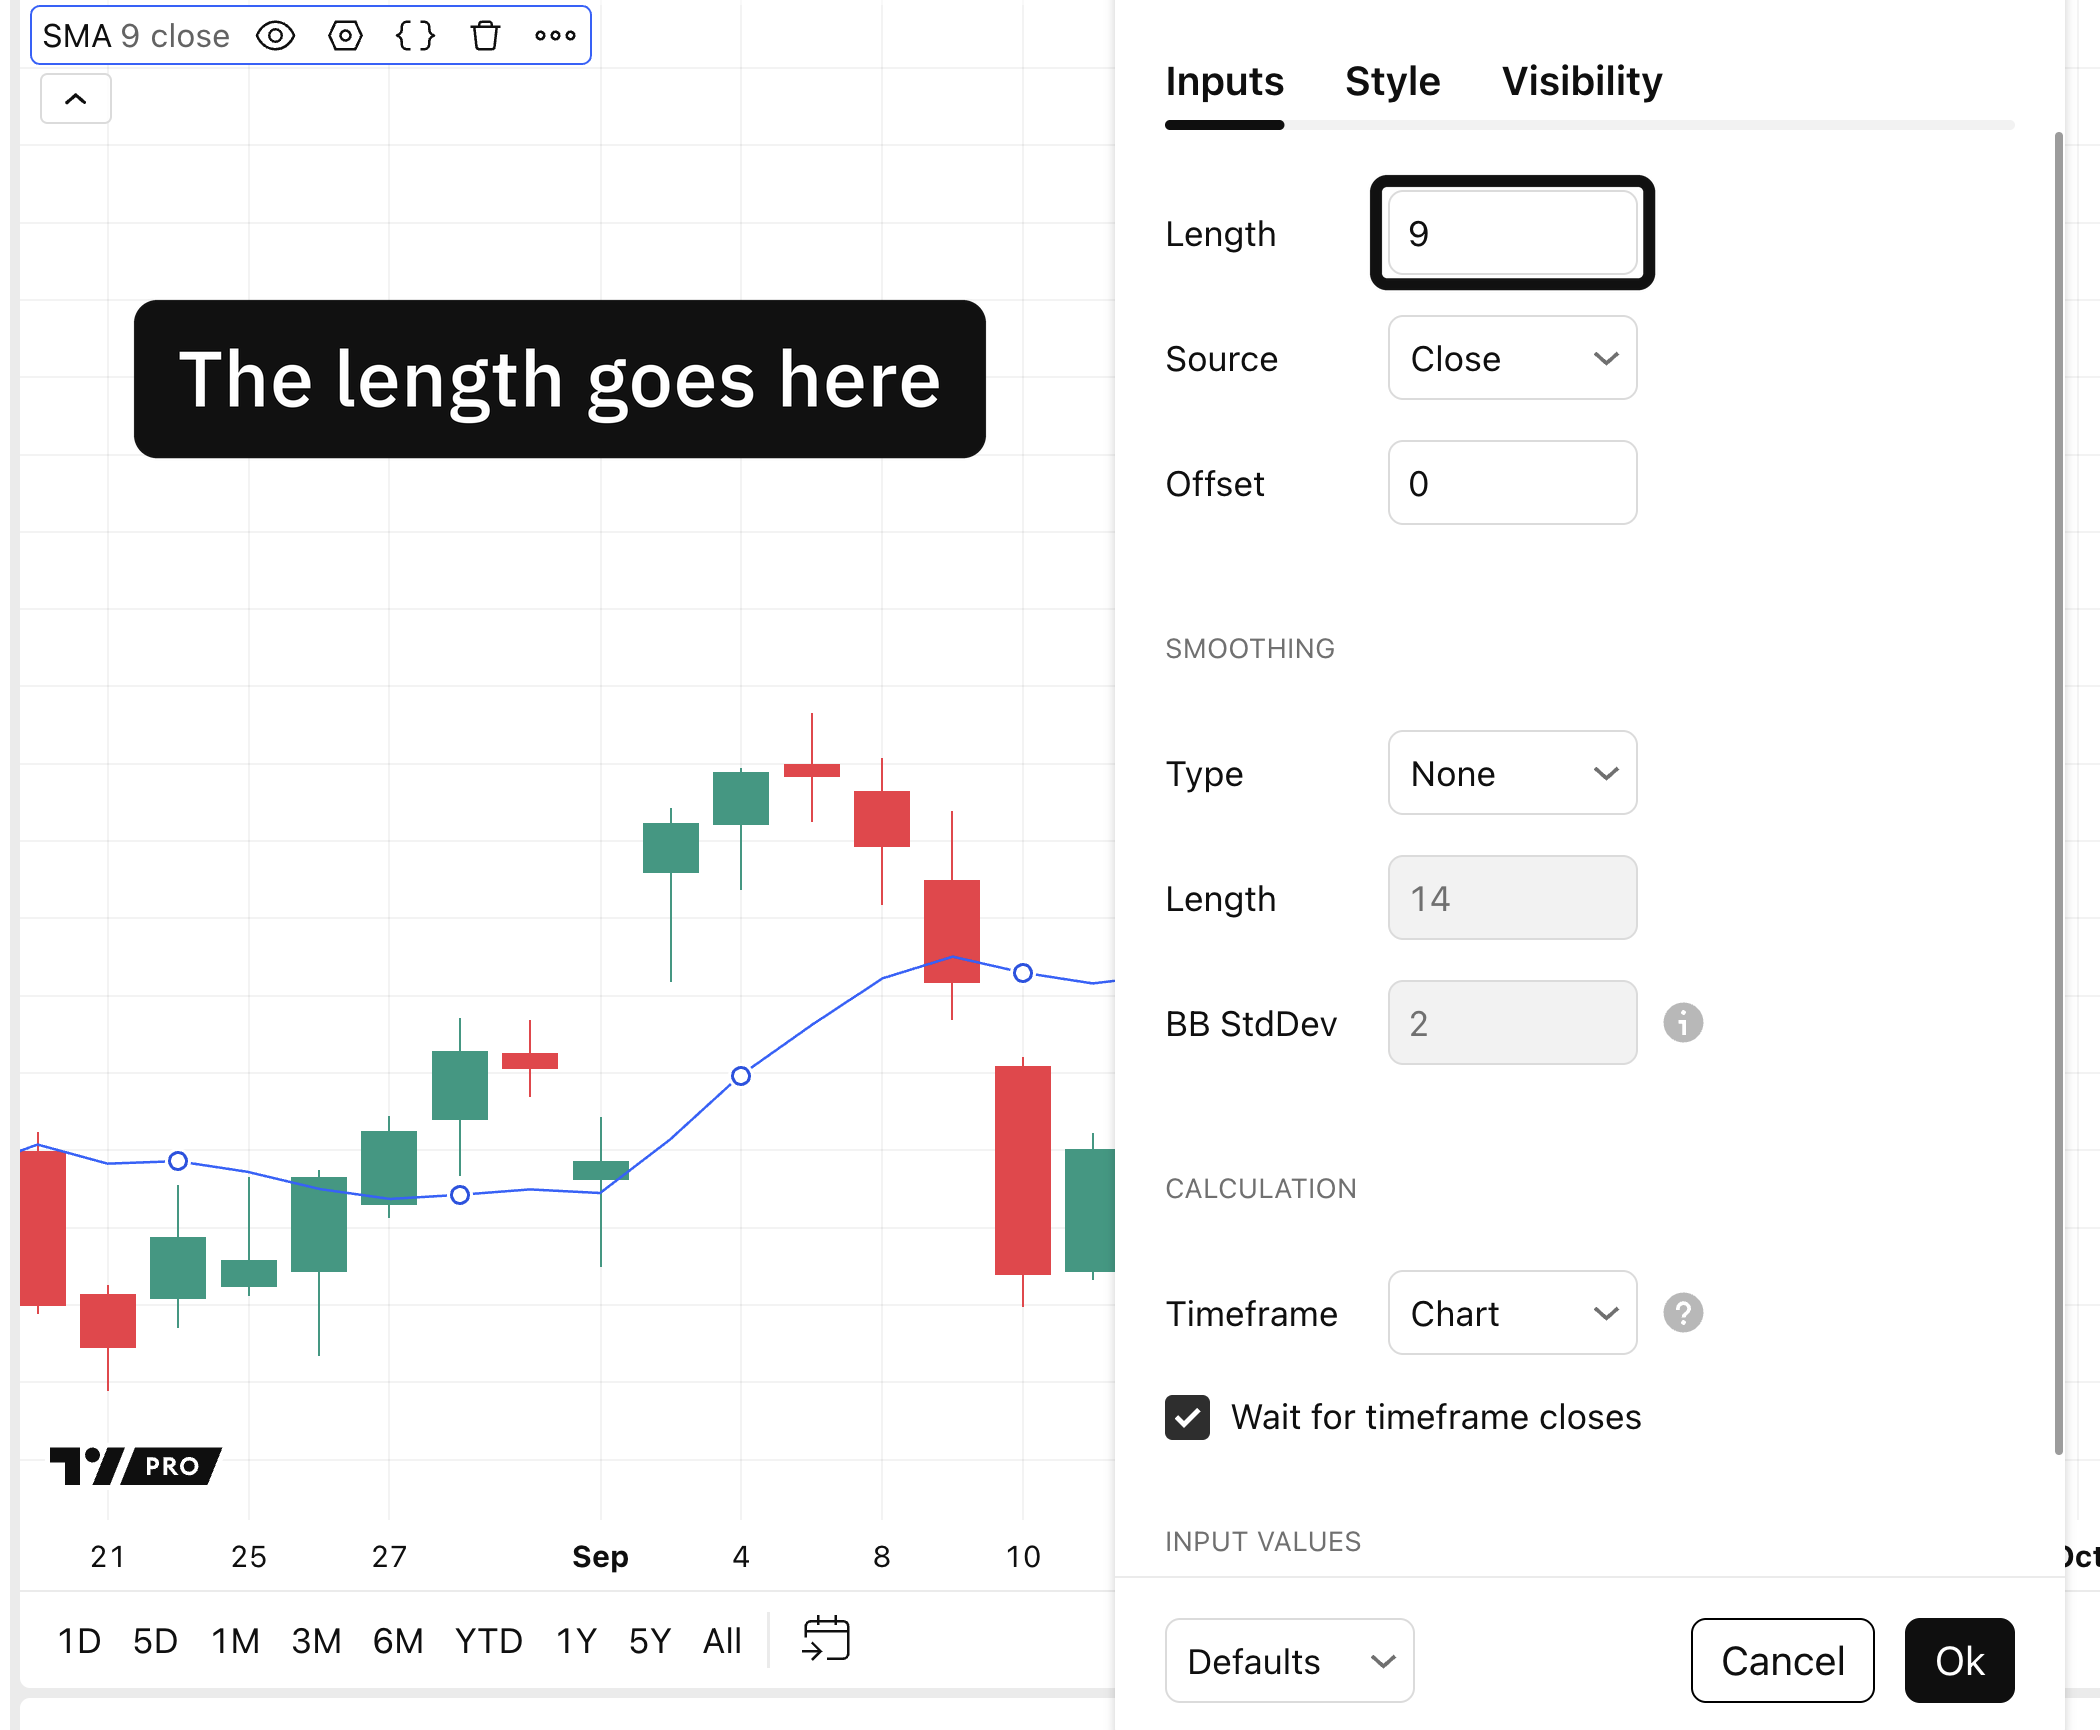
The indicator's own row sits above the candles and the box it opens has one Length field. The number already in it is the platform's default, and the book asks for its own. Charts by TradingView.
The same hovered row carries the eye that hides an instrument and the bin that removes it, which matters because the free plan holds two to a chart as this is written and asks you to drop one before it will take a third.
Which one on which chart
the book is specific about this and the platform will happily let you ignore it.
A length is a convention rather than a correct answer, so a number that reads well on one market carries none of its meaning to another. Change it and watch what happens to the line before you decide it belongs there.
What a length is actually averaging
Typing fifty into a box tells you nothing about what fifty is, and a length is only a count of candles until you turn it back into calendar.
Drag it to what the book asks for and the line stops being a setting. It is about ten weeks of closing prices, drawn as one stroke.
Which also explains why the line turns late. Ten weeks of price has to change direction before a ten-week average does.
Open the dialogue from the top strip and search by name
An average draws over the candles, an index draws in a pane of its own
The settings live behind the instrument's own name in the legend
The same row hides it, and removes it, and the plan holds two
An instrument tells you what its arithmetic says. Whether that is worth anything today is a separate question with no button on it.
Open the dialogue, add the average, and set its length before you add anything else at all.
Where these facts come from
The dialogue's name, the tab names, the two instruments' own names and both of the lengths they arrive with were read off the platform's own help pages on the day this was written, and it can change any of them. Which length to use and which chart to read each one on come from the book. What the length covers in calendar is this course's own arithmetic.