

Pick a Market and a Candle Length
The screen opens on a market somebody else picked, drawn at a candle length somebody else picked.
Two controls on the top strip fix both, and a third decides how much of the result you can see at once. This lesson is those three and where the history runs out.
Four decisions sit between an inherited chart and one you built on purpose, and none of them takes longer than a click.
Four rows, one market
Symbol search is the leftmost thing on the top strip, and clicking the market name already sitting there opens it. Typing anywhere on the chart opens it too. Each row of results has the ticker on the left, a plain description in the middle, and the data source on the right.
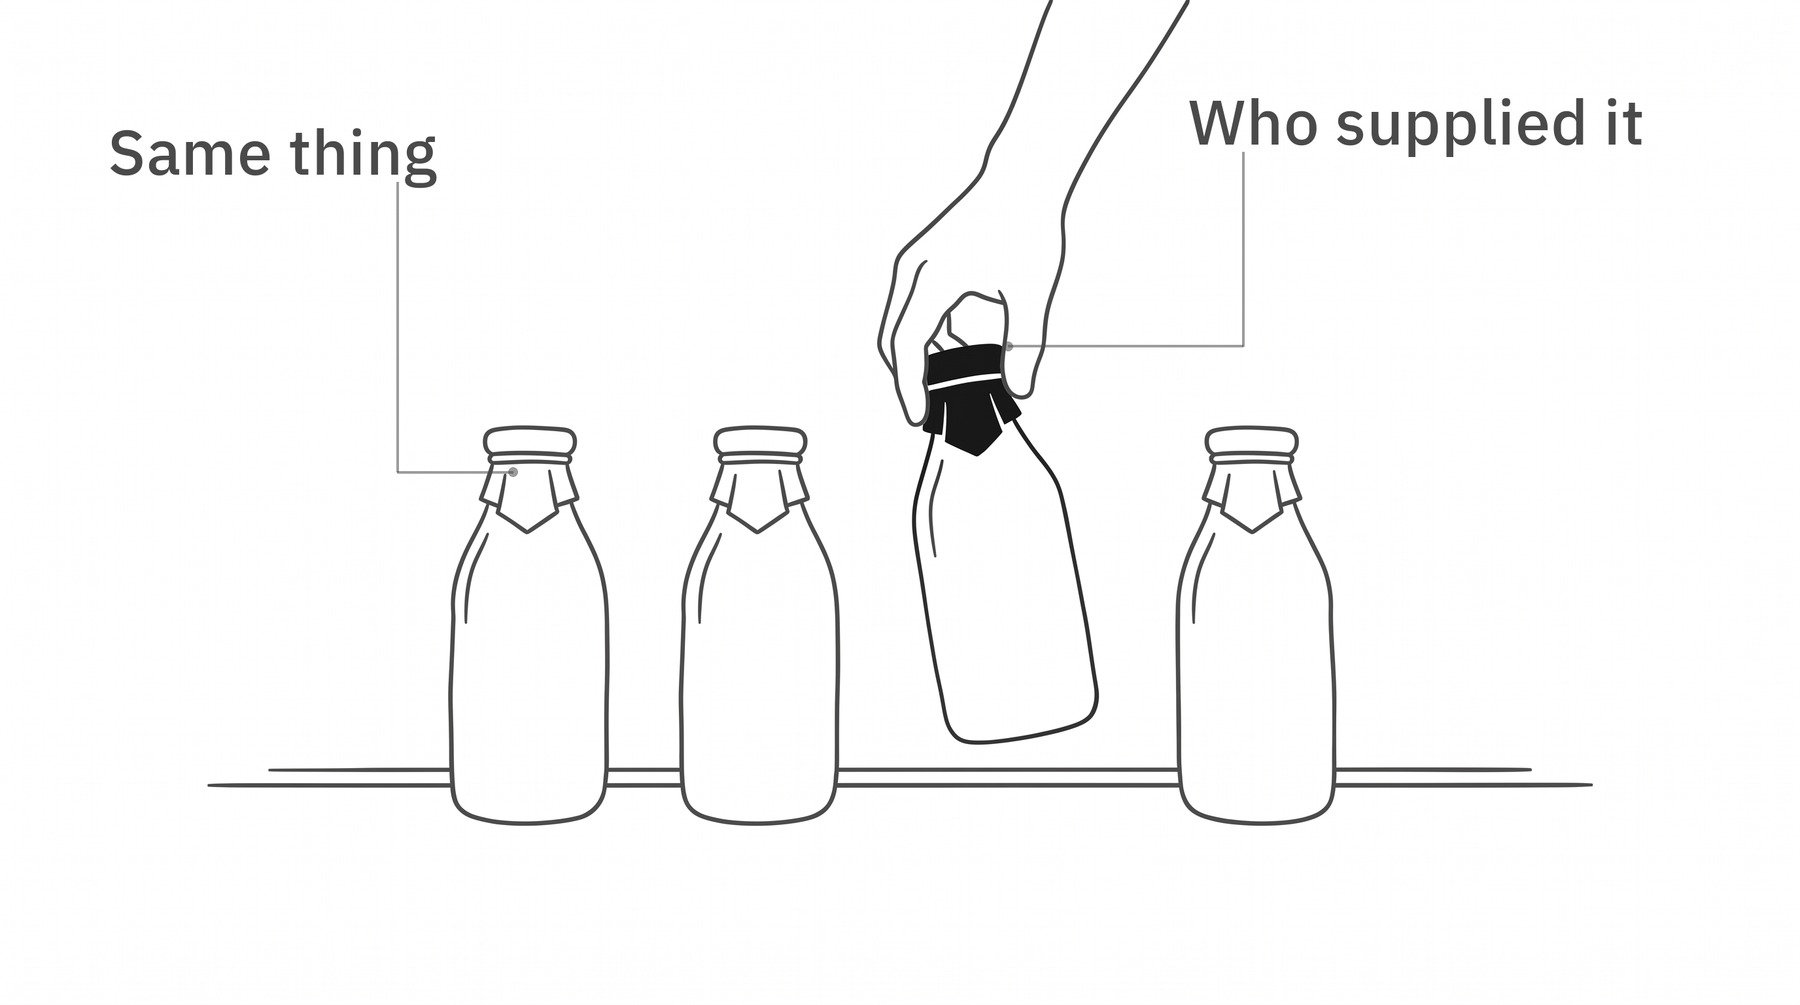
So EUR/USD comes back several times over. Same pair every time. The word on the right is who publishes that price.
Whose price, and how long a candle
One of the sources on the Forex tab is a composite, which the vendor describes as a price built from dozens of contributors. The rest are individual firms quoting their own.
ICE is the composite one, published by an exchange group, and it is the row this course sends you to. A firm's feed puts that firm's name in your legend for as long as the chart is open, which is a thing to choose rather than to inherit.
That one surprises people, and nothing is broken. A composite price has no single venue behind it to count trades at.
Next along the strip is the time interval menu, which sets how much time one candle covers. Its options come in six groups, and weeks and months live inside the group called Days alongside 1 day itself.
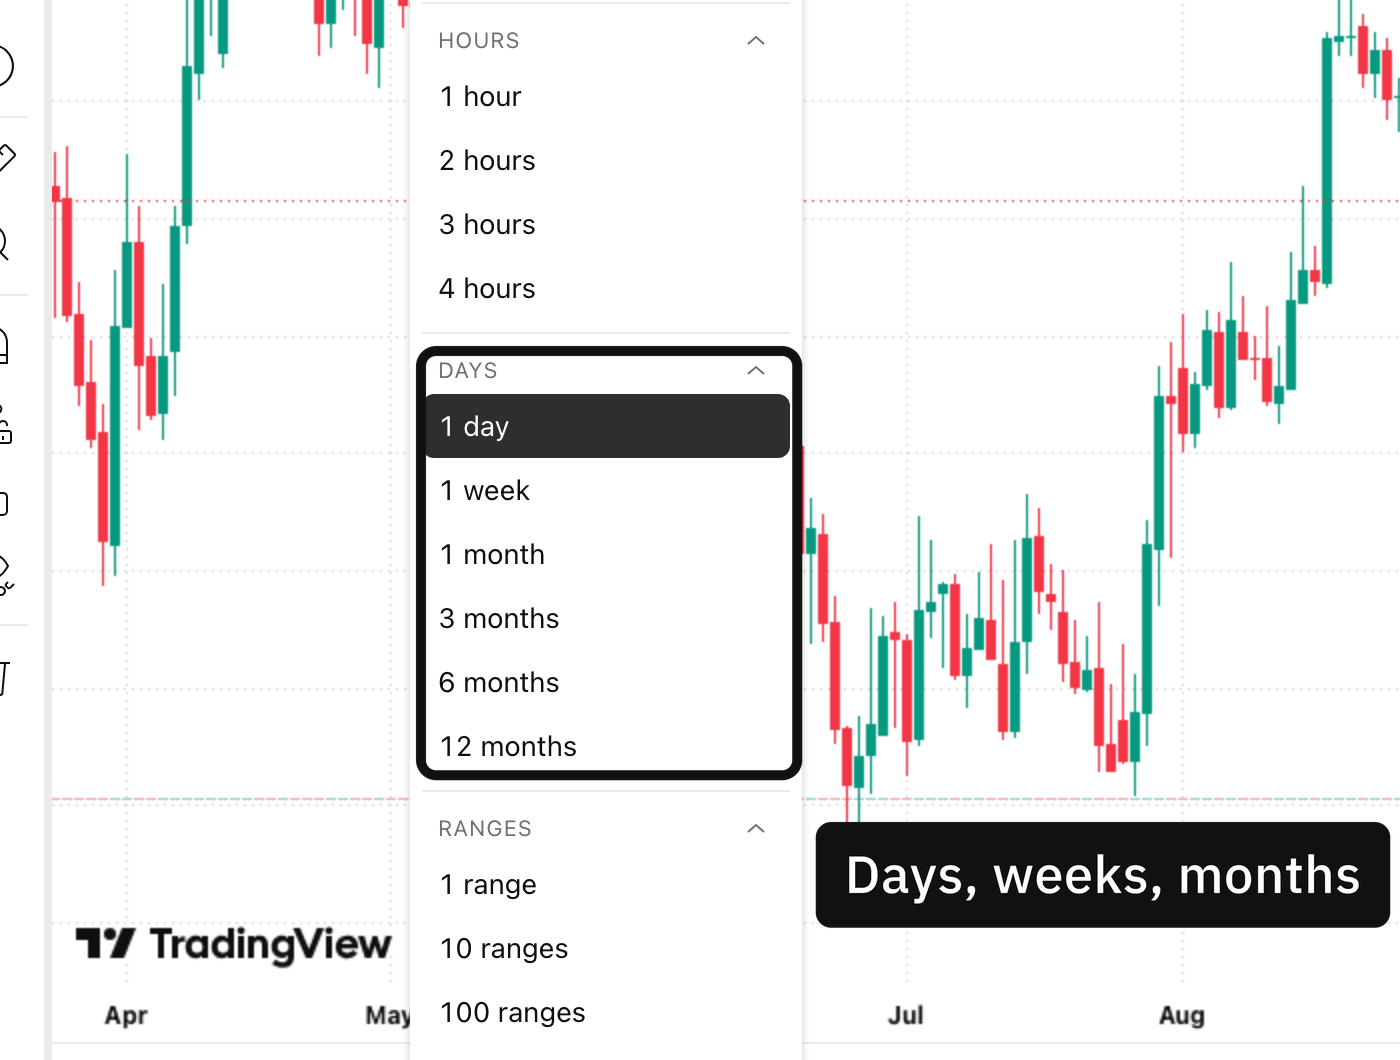
The button on the strip shows one letter and the menu behind it spells the same length out in full, in the group that also holds weeks and months. Charts by TradingView.
Press the star beside an interval and it moves onto the top strip as a button. That button abbreviates, so a menu reading 1 day becomes a button reading D, which is why printed steps and live screens so often disagree.
What kind of chart, and where it stops
Chart type is a separate control from the interval, and the vendor publishes more than twenty of them with seventeen on the free plan at the time of writing. Candlestick is what the book is written for and the rest can wait.
Scrolling back is dragging the time scale or holding the left arrow, and the Go to menu jumps to a date without the dragging.
One screenful at a time
Zoom is a third thing again, separate from both controls above, and it decides how many candles are between the two edges of the pane.
Move the interval and watch the same hundred and fifty candles become a fortnight or most of a decade. The chart underneath has not changed at all.
Worth holding onto, because scrolling and switching feel identical under the hand.
The market comes from symbol search, and the source column decides whose price it is
The candle length comes from the interval menu, and the button abbreviates what the menu spells out
The kind of chart is its own control and candlestick is the one to leave it on
How much is on screen is the zoom, and it changes nothing about the chart
Two controls decide what the chart is. A third decides only how much of it you are looking at.
Build it once in that order and the same screen comes back every time you open it, so the same screenful is a fortnight or a decade depending on one setting.
Where these facts come from
The names of the search, the interval menu and the chart-type control, the six interval groups and the composite source were read off the platform's own help pages on the day this was written. The history rule comes from its own article on intraday limits. That the interval button abbreviates is read off the screen rather than off a page, because the vendor documents the menu and never the button.