

"I have drawn it in the wrong place and now I cannot get rid of it." You have just watched the answer, and this lesson is the four gestures behind it.
Once you have clicked it, a mark on a chart stops behaving like paint and starts behaving like a thing you can pick up.
Everything you draw is an object. It can be selected, moved a step at a time, locked, and thrown away.
Four gestures cover the lot, and the first one is finding the tool.
Which button opens the lines
The rail down the left is sorted into groups, each with its own button, and the second one from the top is the one to press. The vendor's help pages call that group Trend tools. The list it opens is headed Lines, so search under the first name and read the second.
Nine of them draw a straight line, and two are worth knowing now.
Horizontal line runs the full width of the chart, past the last candle and off both edges. Horizontal ray starts where you click and runs right, leaving everything before that date unmarked.
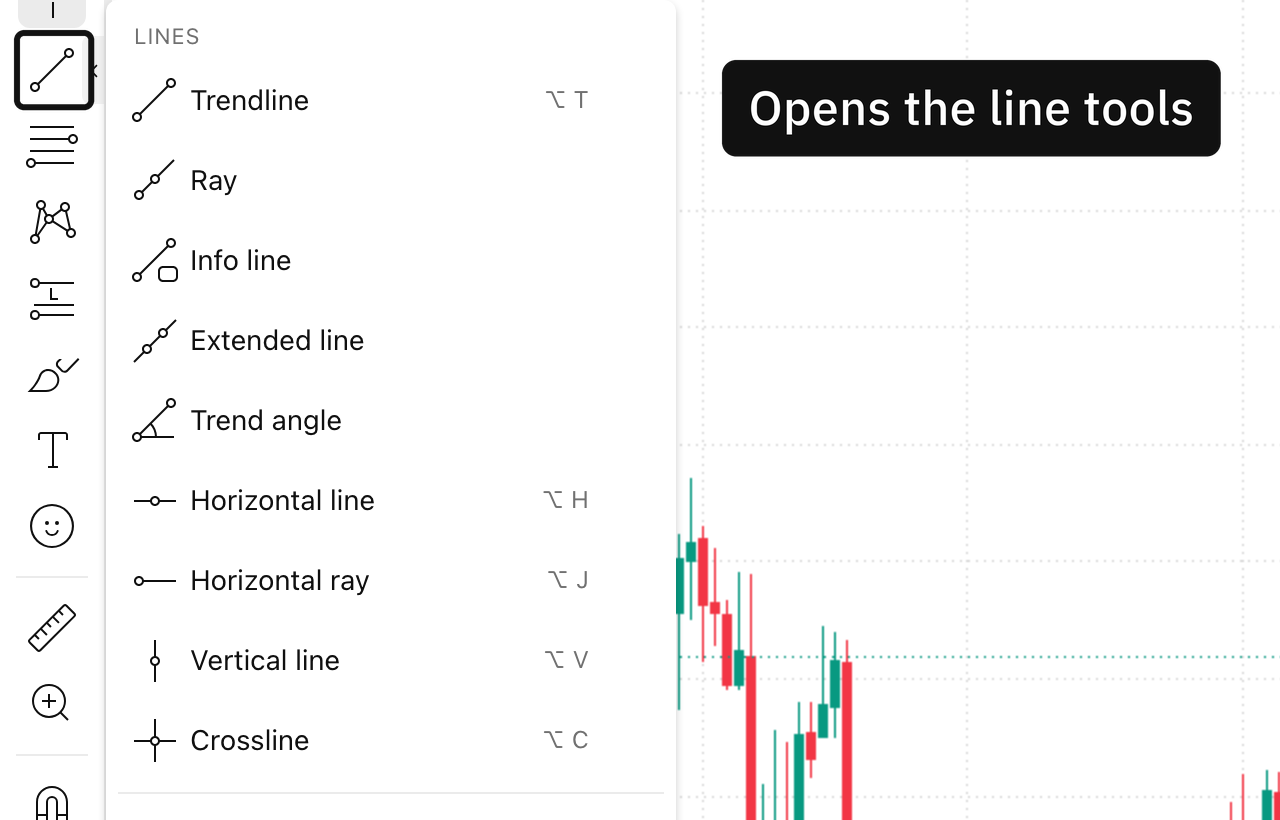
The ringed button on the left edge opens this list, and nine of its rows draw a straight line, with the keyboard shortcut printed beside the ones that have one. Charts by TradingView.
The shortcut is worth having from the first day. Click the price you want and press Alt+H, and the line is there with no menu opened at all.
Two clicks and it exists
Click the tool, then click the height on the chart where you want the line. That is the whole of it.
"Everything that decided anything happened before the click."
The stroke takes a second. Where to put it is a judgement, and it is one the book spends a chapter on rather than something the software will help with.
Click it once and it grows handles
Click a finished line and it lights up, sprouts a small square at each end, and a short row of controls appears beside it.
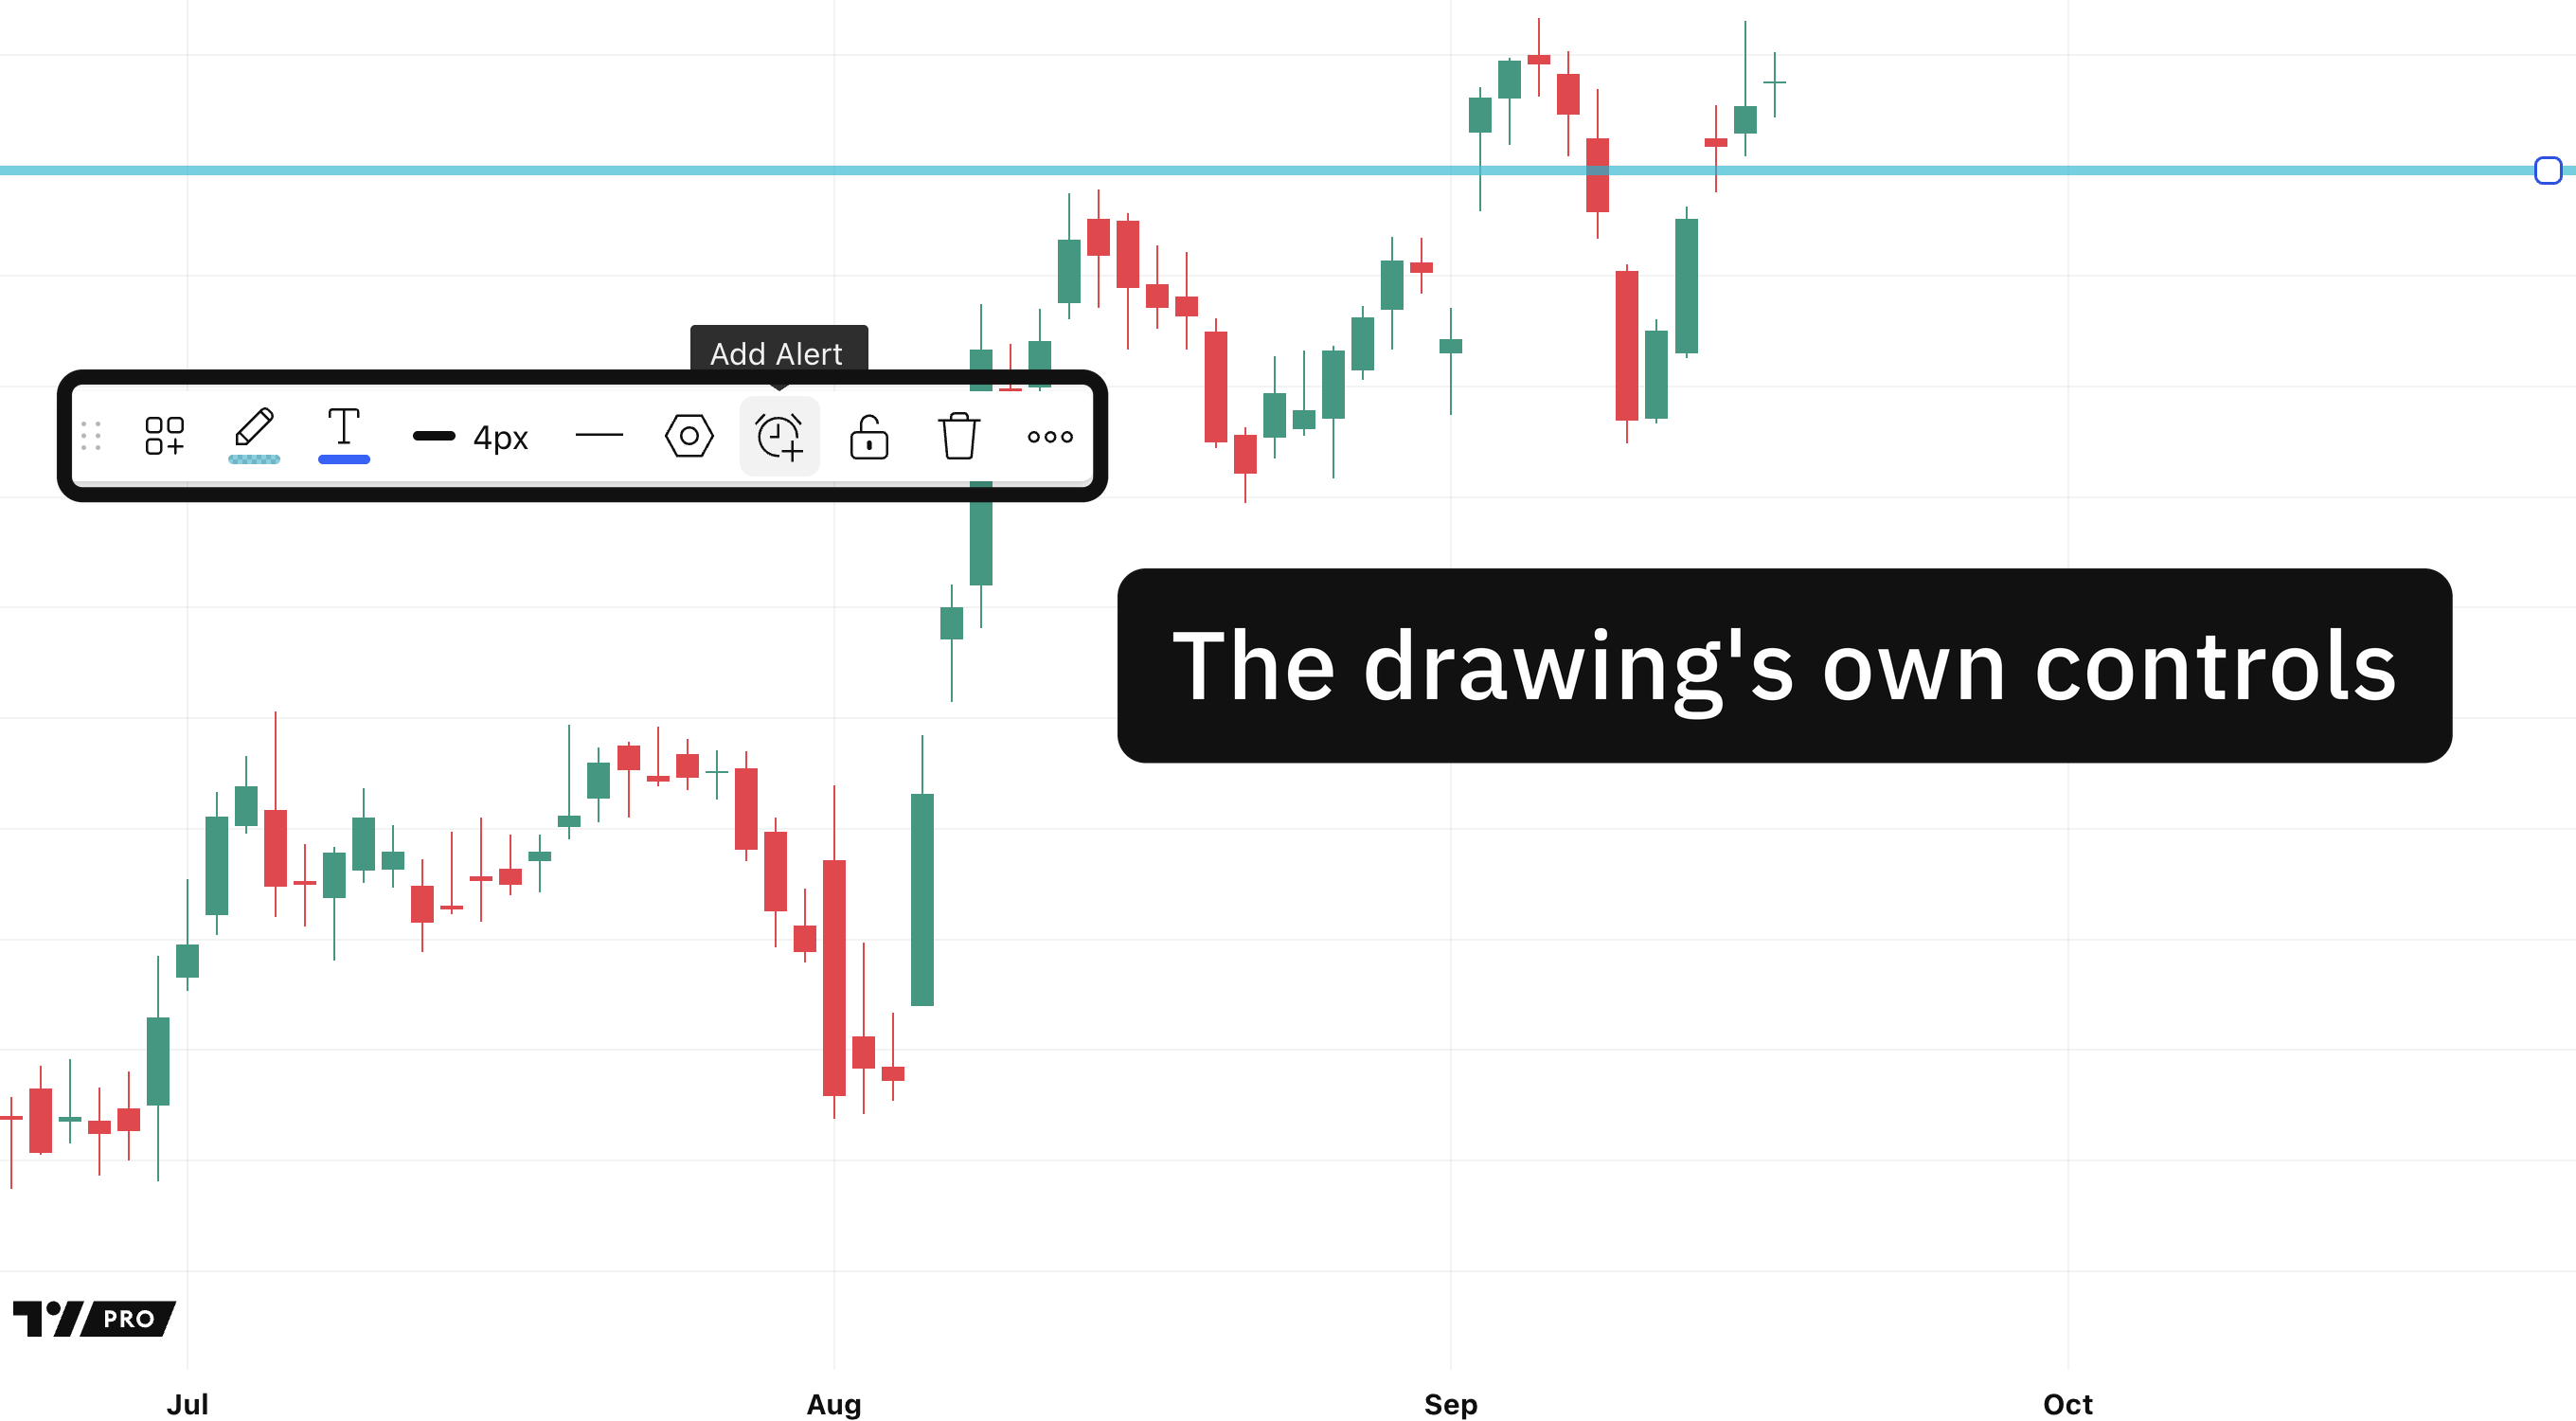
A line that has been clicked once, with its own small row of controls standing above it and a round handle out at the far end of the line itself. Charts by TradingView.
That row is the floating drawing toolbar, and it carries the drawing's own settings, its colour, a padlock and a bin. Everything you will ever do to that line is on it.
Moving it, and taking it off
Drag the line and the object travels with the pointer. Hold Shift while you drag and it will only move straight up or straight across, which is what you want on a level that must not drift in time.
For anything fiddly the arrows beat the pointer, and taking a line off again has three routes with the bin on that floating row as the everyday one.
Hold Ctrl or Command and click several drawings to move, copy or delete them together
The button at the bottom of the left rail opens Remove Drawings & Indicators for a clean sweep
The Object tree on the right rail lists everything on the chart, which is the answer when a drawing is buried under another one
A line that refuses to move is almost always a locked one, and locked lines look exactly like the rest. The same left rail has a lock-everything switch, and it is easier to press by accident than you would think.
Drawings ride with the saved layout. Watchlists and alerts do not, which the vendor states plainly and beginners find out the hard way.
Which leaves one thing this manual will not settle for you. How many lines can a chart carry before you stop being able to read it?
Where these facts come from
The group names, the nine tools, the shortcut, the arrow-key steps and the multiple-selection gesture were read off the platform's own help pages on the day this was written. That the group's own list is headed differently from the name in those pages comes off the screen instead. Which lines are worth drawing is the book's subject and not this manual's.