

"I'll put the line exactly on the low." You have just watched what a line drawn that precisely does to a beginner, and this lesson is the habit that replaces it.
One line goes on the chart you built in the last lesson, and it goes on the last clear low. What follows is what that line is for.
The line is a record of a decision you already made. Price has never seen it and never will.
So this lesson does three things. It says how wide the place you drew really is, what the width buys you, and where the tool lives.
A level covers a stretch
Beginners rule the line to the fifth decimal, watch price turn two pips short of it, and conclude the software is broken.
A level covers a span of price rather than a single figure. Orders bunch near a round number. Take-profits sit on it and stops sit just past it, so the whole stretch is the level, usually a few pips wide.
A trough is that last clear low before price turned back up, and it gets the same treatment. The exact figure was one print on one afternoon, so traders give it room.
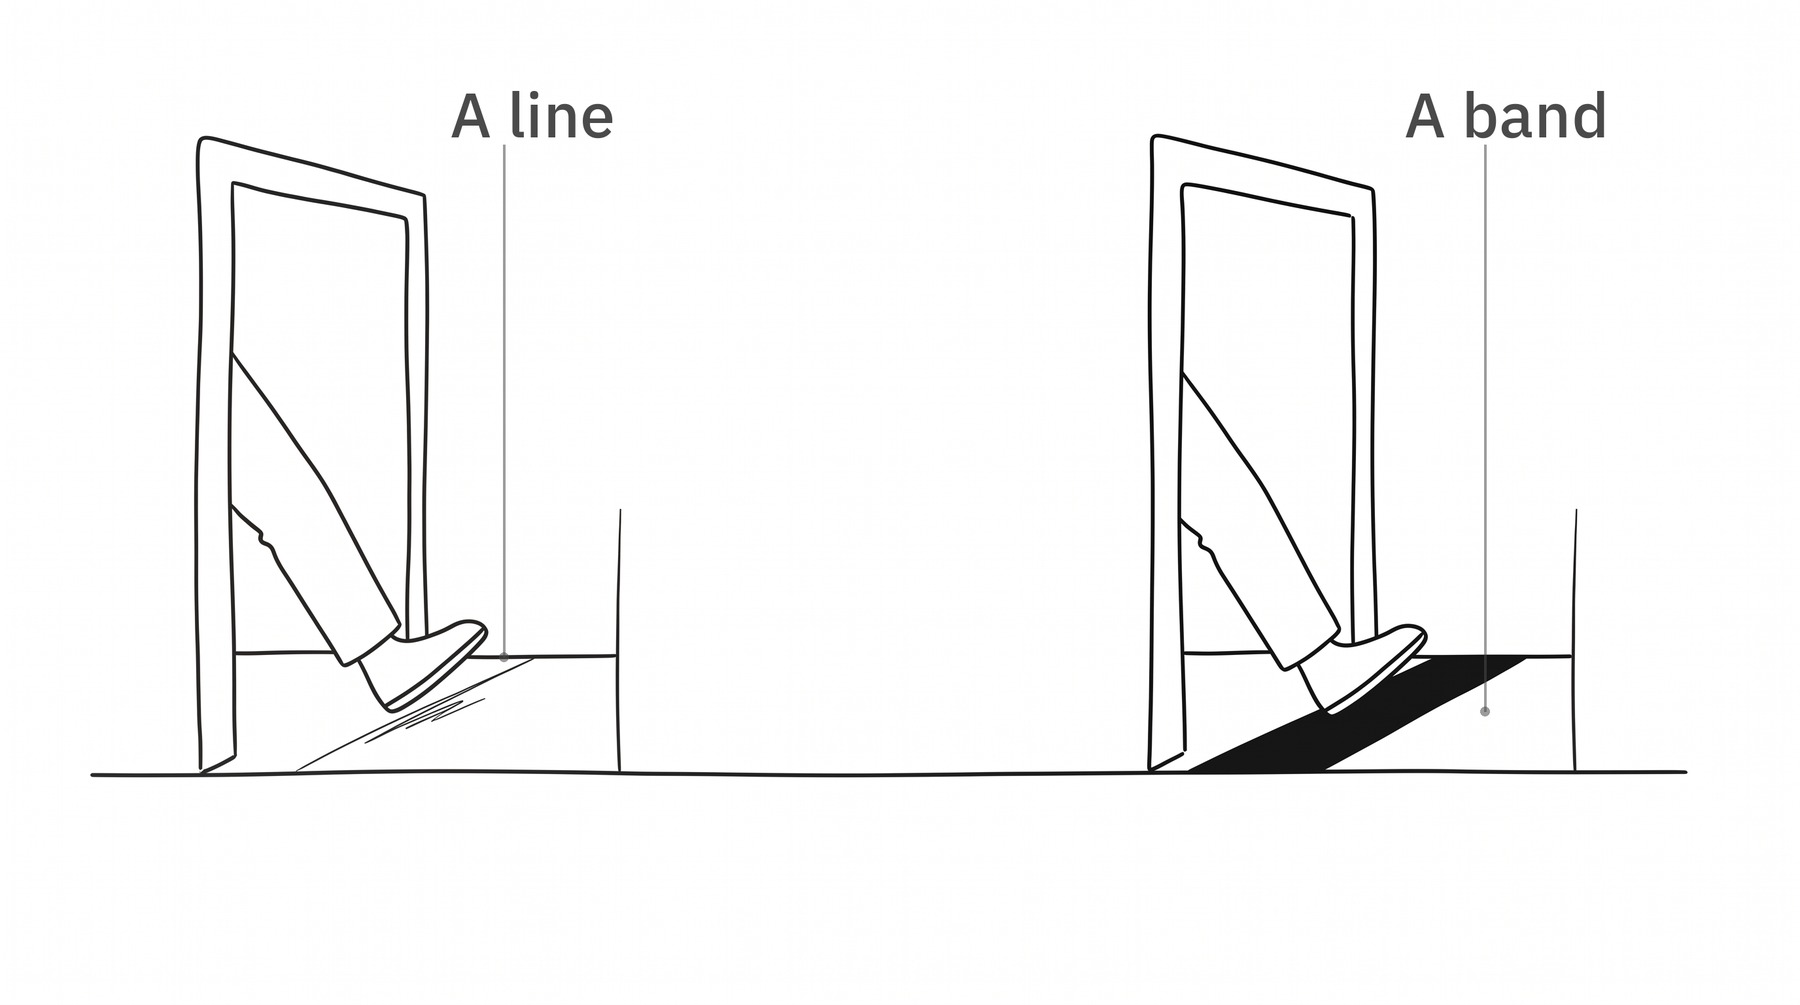
Both are the same doorway. One of them you can stand in without arguing about whether you arrived.
The stop sits under the whole band
Which is why the stop goes below the band and never on the line itself. Put it on the line and the ordinary few pips of overshoot closes you out of a trade that then does exactly what you expected.
The example in the book draws its line at 1.1720 and sets its stop at 1.1700. That gap is the band, written down.
"This is a place where I have a decision ready."
Say that over the line instead of anything about where price will turn. It still holds on the day the level breaks, and every level breaks eventually.
Which makes the following worth sitting with for a second.
Your line sits on the trough at 1.1720. Price falls to 1.1723, turns, and the candle closes back up. What happened?
Price reached the level, because the level is a band rather than a figure
Price missed the level, so nothing has been tested yet
The line went on the wrong low and should be moved down
Three pips short of a drawn line is inside the band on any reading. The second answer is the one that costs money, because a reader holding out for the exact figure sits out the move and then watches it go.
What the width is worth
The width is what tells you where the stop goes, and the two of them together give you a distance. That distance in pips is the number the sizing arithmetic runs on, so a pullback that stops eighty pips above the low and one that comes all the way in are two different trades on the same idea.
The last clear low, marked so you can still find it in a month
The width of the band around it, which is a judgement and stays one
The distance from your entry down to under the band, counted in pips
Where the tool lives
Drawing tools run down the left side of the chart, grouped by kind. Open the second group from the top and its list is headed Lines, with the horizontal line in it alongside the trend line and the ray.
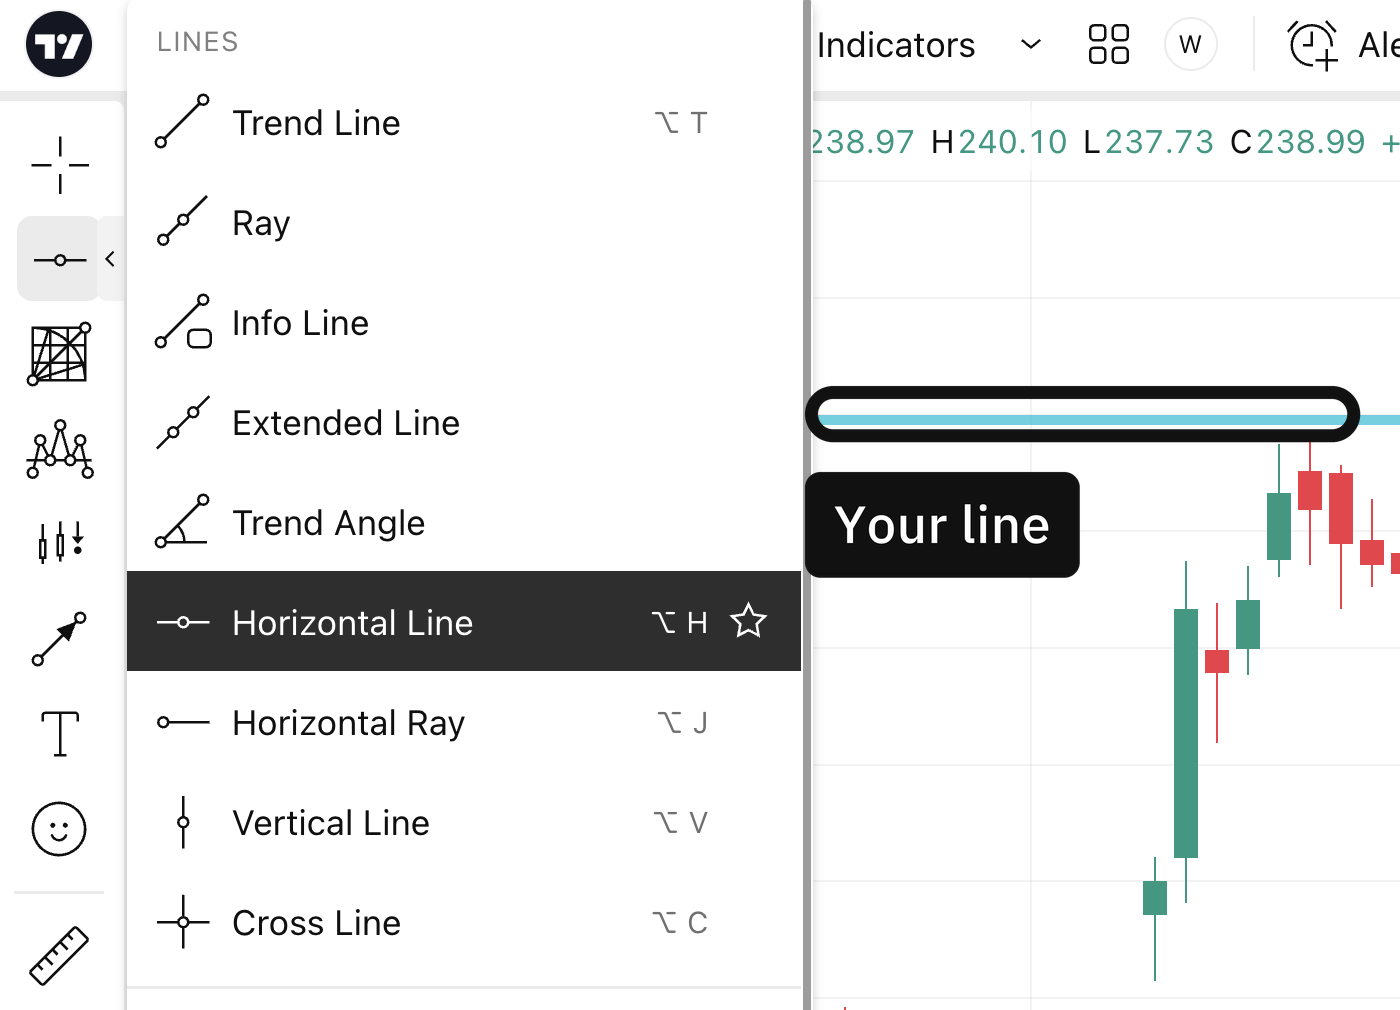
The tool is one row in the list of line tools that opens off the left edge, and the pale blue stroke ringed on the chart is what a single click leaves behind. Charts by TradingView.
Click the tool, click the level, and the stroke takes a second. Everything that decided anything happened before it. Then the honest part, which is that a line you drew yourself carries the authority of ink, and having drawn it you will find it harder to walk away from a trade going against you. So which stalls count as levels and which are noise?
Two experienced traders mark the same chart differently and both are being reasonable.
Where these facts come from
The tool's location and the name of the group holding it were read off the platform's own help centre on the day this was written, and both are its to change. The trough at 1.1720, the stop at 1.1700 and the twenty pips between them are quoted from the book rather than recomputed. How orders bunch around a level is that book's framework and not a measured finding.