

One Chart, Six Months Back
The screen opens on something busy, and most of what is on it belongs to people trading things you are not trading.
Nearly all of it can be ignored. This lesson builds one chart out of four decisions and then saves it.
Four decisions make the chart this course runs on, and none of them takes longer than a click.
The market, the candle, the window, and whether it survives.
The strip across the top
Symbol search sits at the far left of the strip running along the top. Click the symbol name already sitting there, start typing, and pick EUR/USD out of the list.
Next along the same strip is the chart interval, which is the control deciding how much time one candle covers. Open it and take 1 day from the group of days. Once it is set, that button reads a single D.
Now the part that catches people. Under the chart sits a second row of shortcuts, and the first of those reads 1D. That one sets a date range and drops you onto one-minute candles.
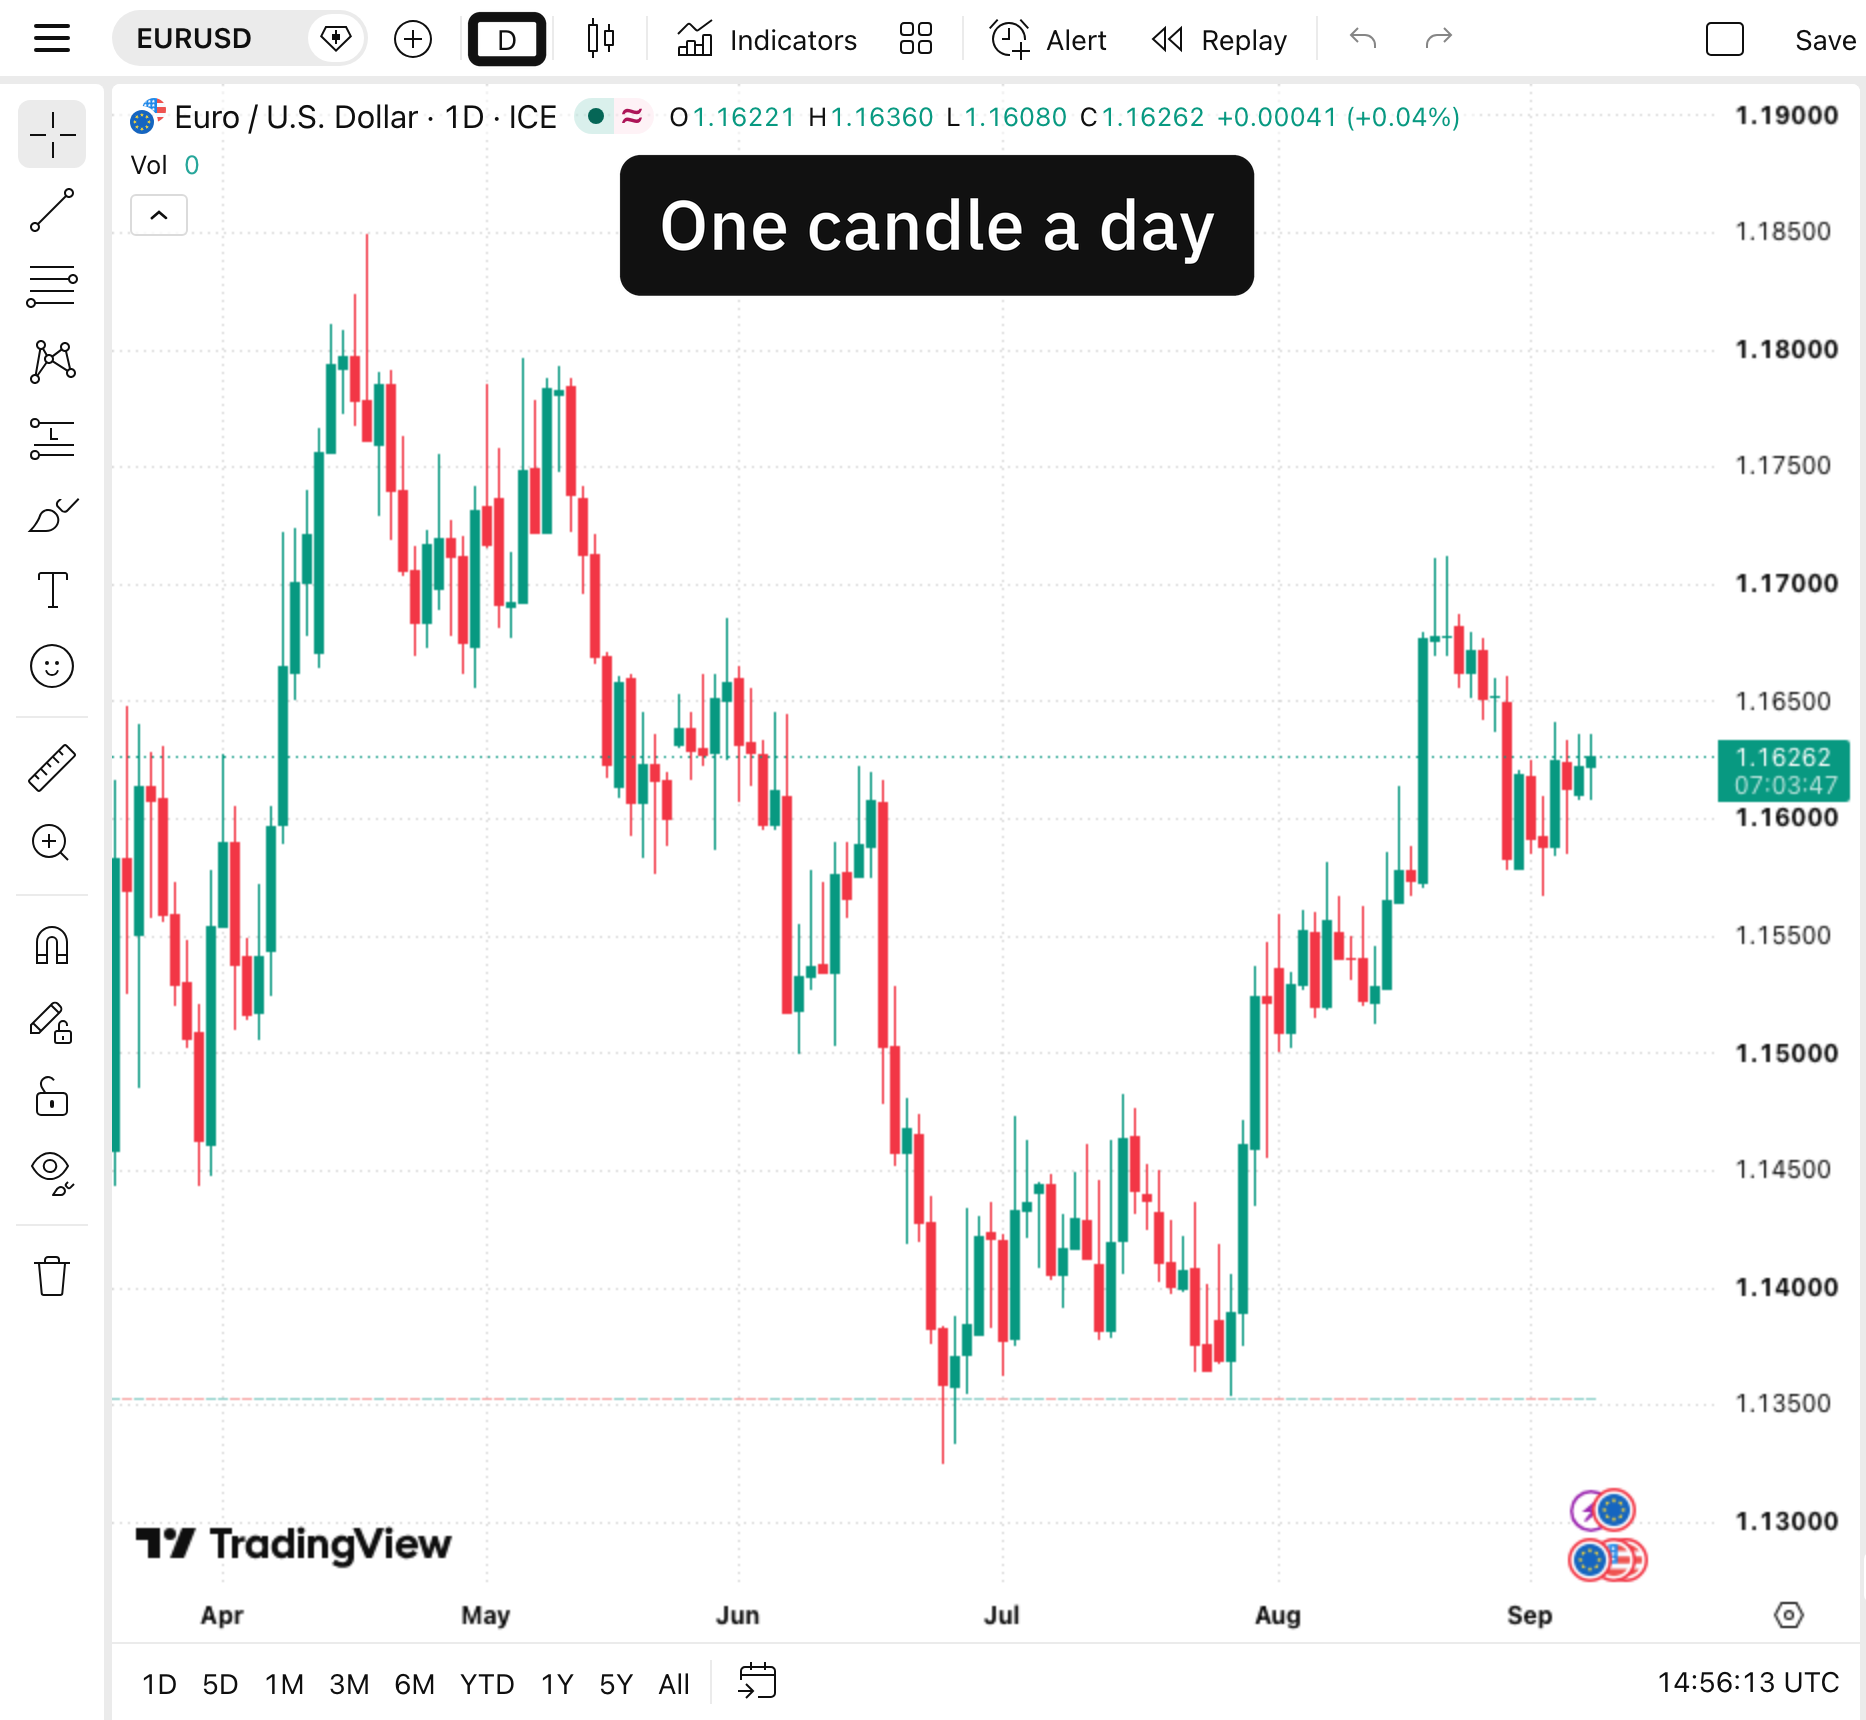
The ringed button on the top strip reads D and sets how much time one candle covers, and the 1D in the row of shortcuts along the bottom only changes how far back you are looking. Charts by TradingView.
The control on the top strip is the one this course wants from you. The one underneath is a zoom, and the day in its name is a stretch of dates rather than the width of a candle.
What one candle keeps
A candle covers a stretch of time and summarises everything that happened inside it. Set the interval to one day and each candle carries one day.
The thick middle is the body, and it runs between the open and the close. The thin lines above and below are the wicks, marking how far price got before it came back.
A long lower wick says sellers took price down there and buyers took it back the same day. One fact, about one day.
You set the interval to 1 day, then click the 1D in the row underneath the chart. What is on the screen now?
One trading day drawn in one-minute candles, because that row sets a date range
The same daily chart, zoomed so it fits the screen neatly
Six months of daily candles, which is the window this method wants
Two controls, both naming a day, two jobs. The interval decides how much time a candle covers. The row underneath decides how much of the chart is on screen, and asking it for a day puts you on minute candles.
Save it or lose it
Work done while signed out disappears with the tab, so the free account comes first. After that, Manage layouts on the upper strip is where a chart gets saved, and a blue Save shows under the layout's name whenever something is unsaved.
EUR/USD, taken from the symbol search
The interval on 1 day, set from the top strip rather than the row beneath it
Nothing added on top, because two indicators is the whole allowance and neither is wanted yet
About a hundred and thirty candles
Scroll back now until roughly the last six months sit in view. That is about a hundred and thirty of them, because a currency pair prints on weekdays and rests at the weekend.
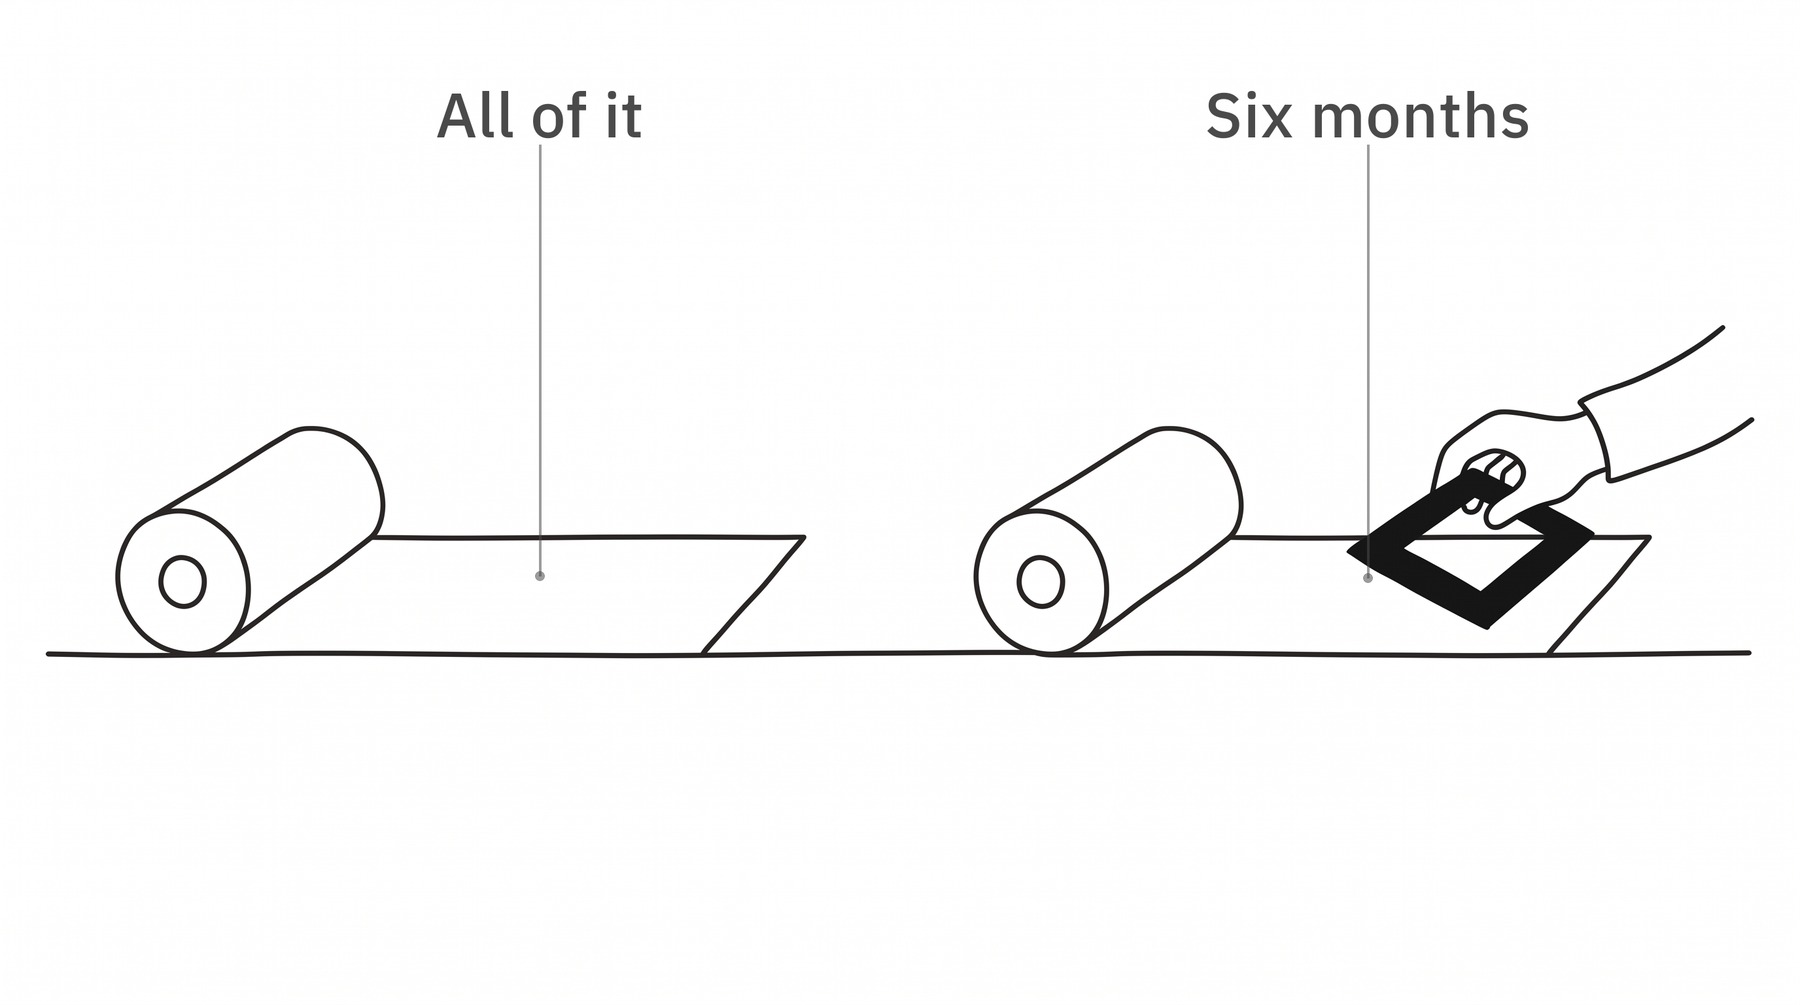
Everything else is still behind the window. You are choosing what to look at rather than throwing anything out.
Six months is the window this method reads direction over, and it is a working convention rather than a law. Somebody trading inside a day wants a shorter candle and a tighter window, and the count of candles moves with both.
One market, one candle length, one window, saved. That is the chart, and nothing else gets added to it here.
Where these facts come from
The names and positions of the symbol search, the chart interval and the layout controls were read off the platform's own help centre on the day this was written, and it can move any of them. That both controls name a day is described on that same page. The count of about a hundred and thirty candles is weekday arithmetic done here rather than a published figure, and the six-month window is the book's convention.